Grafana Tempo
Grafana Tempo Configuration
There are two possibilities to integrate Kiali with Grafana Tempo:
- Using the Grafana Tempo API: This option returns the traces from the Tempo API in OpenTelemetry format.
- Using the Jaeger frontend with the Grafana Tempo backend.
Using the Grafana Tempo API
There are two steps to set up Kiali and Grafana Tempo:
- Set up the Kiali CR updating the Tracing and Grafana sections.
- Set up a Tempo data source in Grafana.
Set up the Kiali CR
This is a configuration example to set up Kiali tracing with Grafana Tempo:
spec:
  external_services:
    tracing:
      # Enabled by default. Kiali will anyway fallback to disabled if
      # Tempo is unreachable.
      enabled: true
      # Tempo service name is "query-frontend" and is in the "tempo" namespace.
      # Make sure the URL you provide corresponds to the non-GRPC enabled endpoint
      # It does not support grpc yet, so make sure "use_grpc" is set to false.
      in_cluster_url: "http://tempo-tempo-query-frontend.tempo.svc.cluster.local:3200/"
      provider: "tempo"
      use_grpc: false
      # Public facing URL of Tempo
      url: "https://tempo-tempo-query-frontend-tempo.apps-crc.testing/"
The default UI for Grafana Tempo is Grafana, so we should also set the Grafana URL in the Kiali configuration, such as this example:
spec:
  external_services:
    grafana:
      in_cluster_url: http://grafana.istio-system:3000
      url: https://grafana.apps-crc.testing/
Set up a Tempo Datasource in Grafana
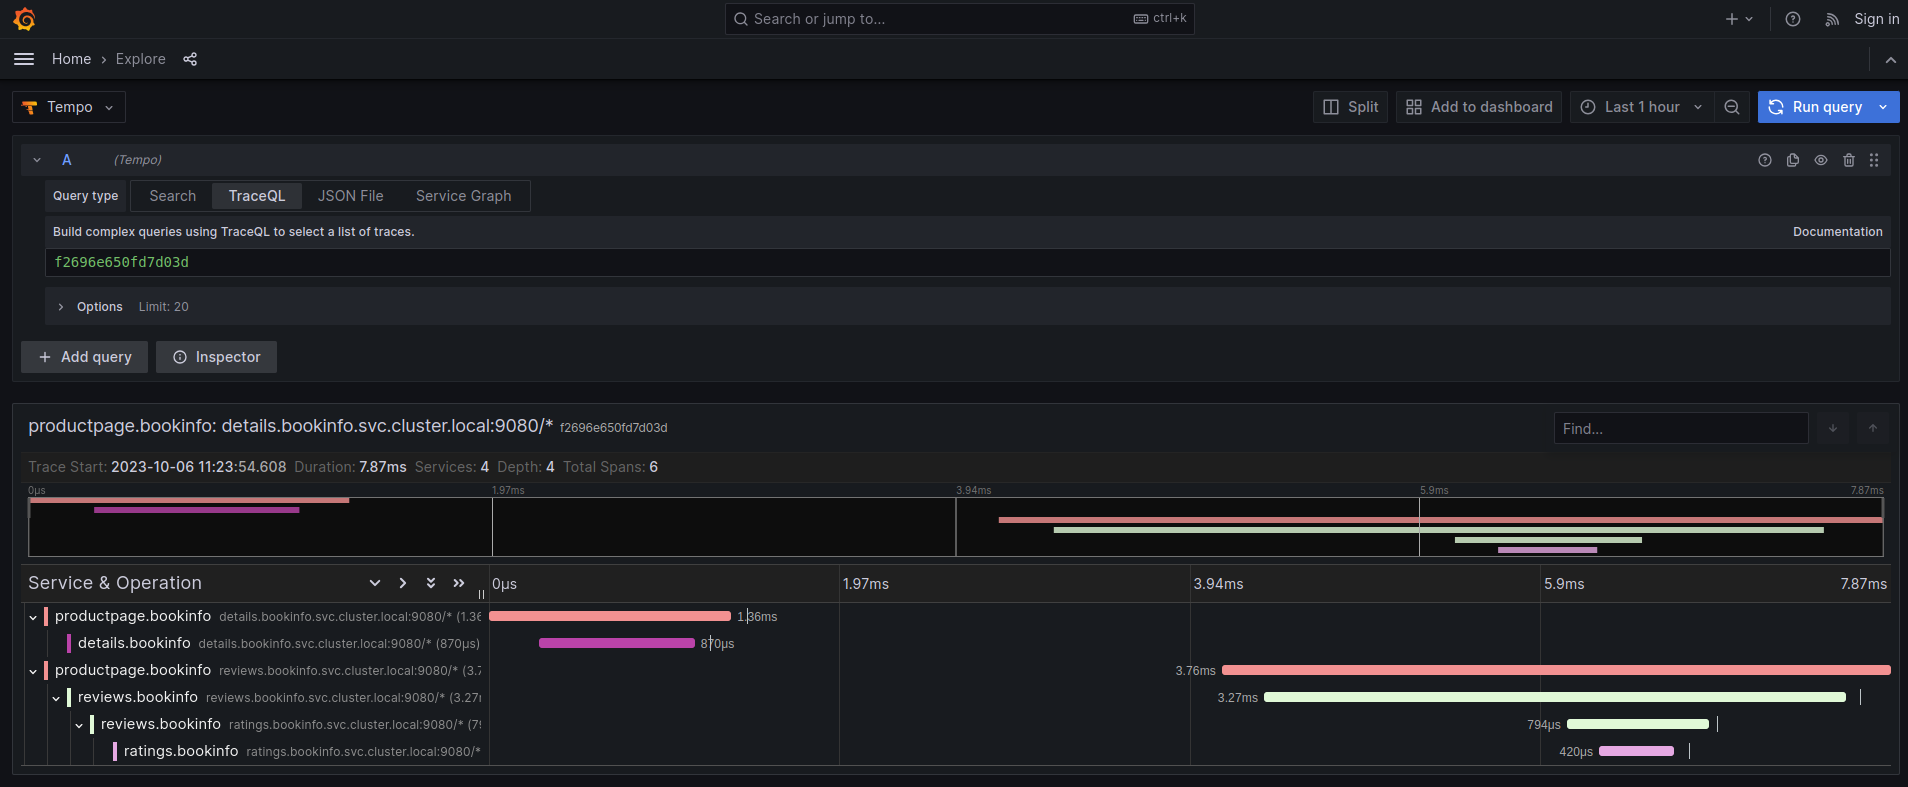
We can optionally set up a default Tempo datasource in Grafana so that you can view the Tempo tracing data within the Grafana UI, as you see here:
To set up the Tempo datasource, go to the Home menu in the Grafana UI, click Data sources, then click the Add new data source button and select the Tempo data source. You will then be asked to enter some data to configure the new Tempo data source:
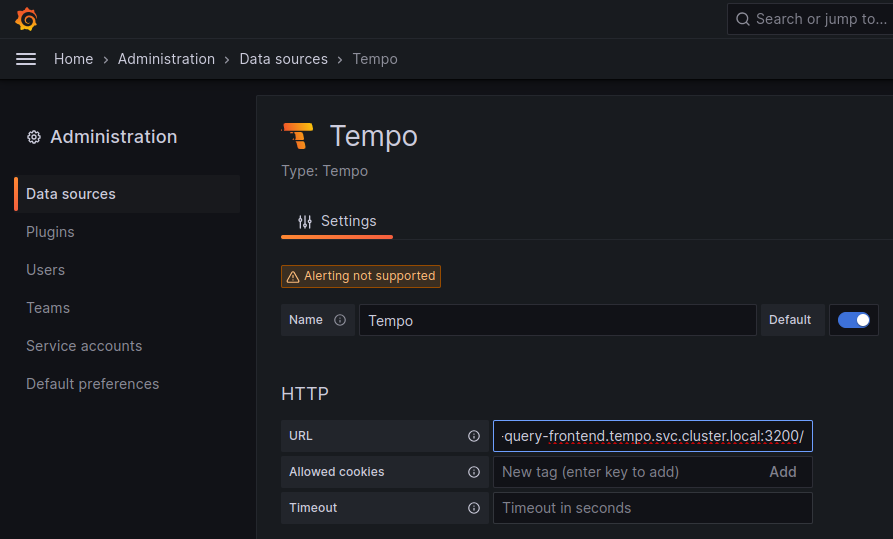
The most important values to set up are the following:
- Mark the data source as default, so the URL that Kiali uses will redirect properly to the Tempo data source.
- Update the HTTP URL. This is the internal URL of the HTTP tempo frontend service. e.g.
http://tempo-tempo-query-frontend.tempo.svc.cluster.local:3200/
Additional configuration
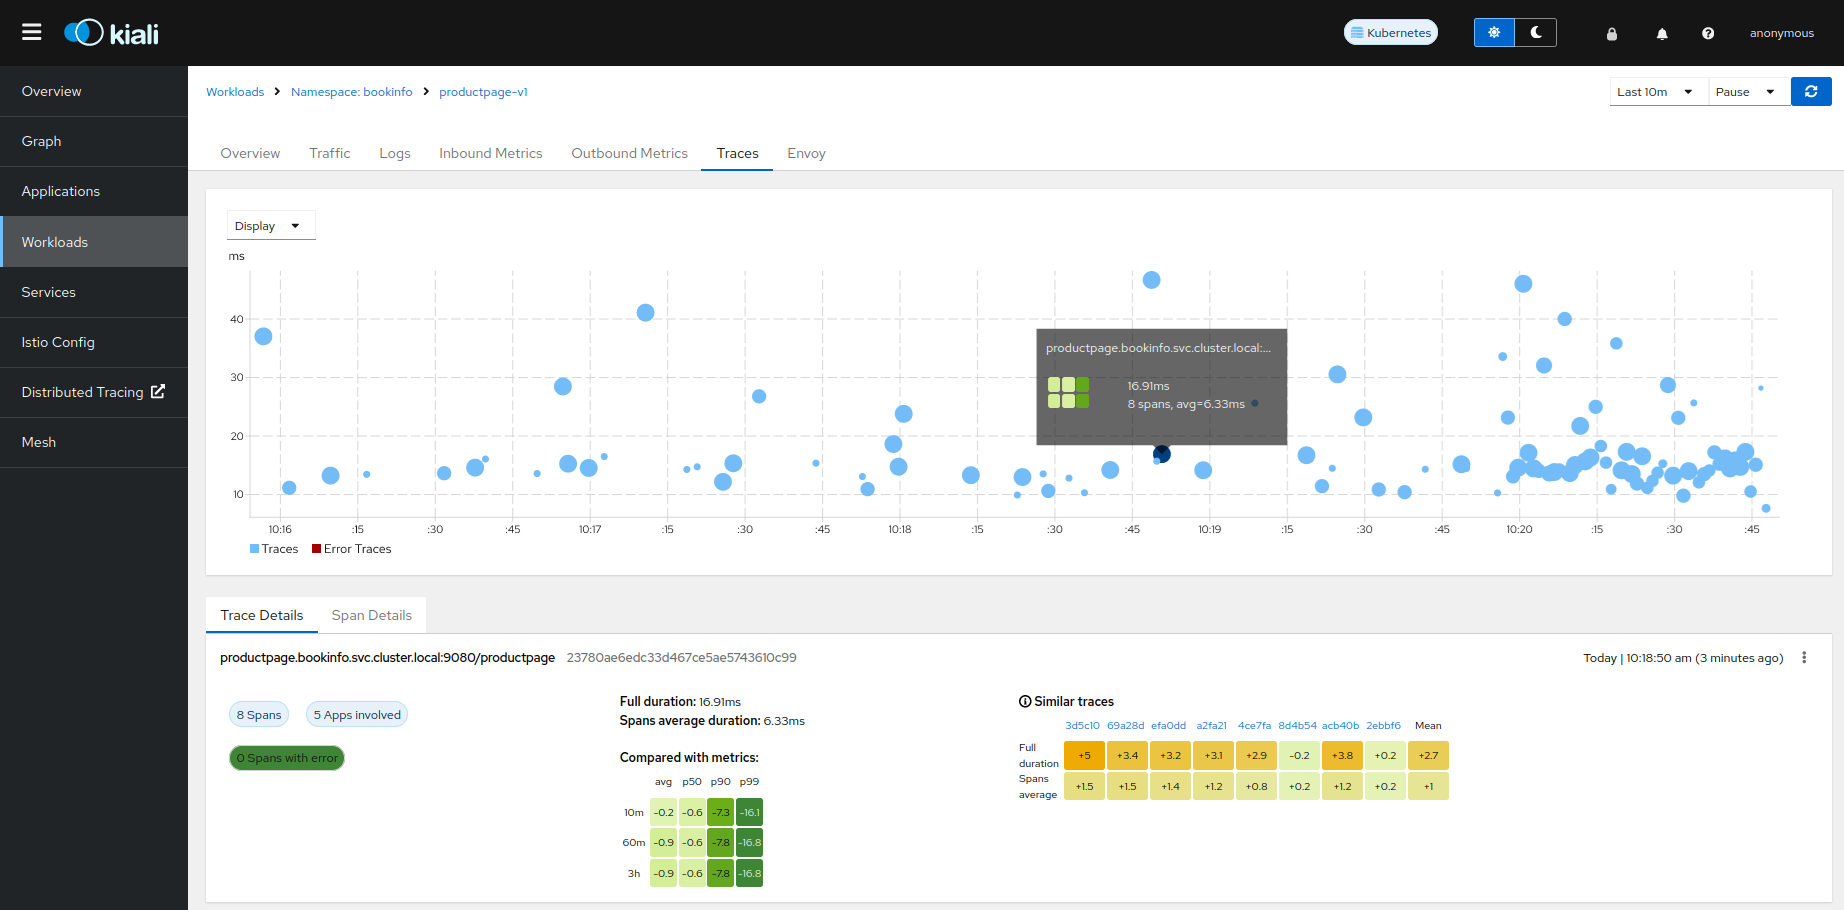
The Traces tab in the Kiali UI will show your traces in a bubble chart:
Increasing performance is achievable by enabling gRPC access, specifically for query searches. However, accessing the HTTP API will still be necessary to gather information about individual traces. This is an example to configure the gRPC access:
spec:
  external_services:
    tracing:
      enabled: true
      # grpc port defaults to 9095
      grpc_port: 9095
      in_cluster_url: "http://query-frontend.tempo:3200"
      provider: "tempo"
      use_grpc: true
      url: "http://my-tempo-host:3200"
Using the Jaeger frontend with Grafana Tempo tracing backend
It is possible to use the Grafana Tempo tracing backend exposing the Jaeger API. tempo-query is a Jaeger storage plugin. It accepts the full Jaeger query API and translates these requests into Tempo queries.
Since Tempo is not yet part of the built-in addons that are part of Istio, you need to manage your Tempo instance.
Tanka
The official Grafana Tempo documentation explains how to deploy a Tempo instance using Tanka. You will need to tweak the settings from the default Tanka configuration to:
- Expose the Zipkin collector
- Expose the GRPC Jaeger Query port
When the Tempo instance is deployed with the needed configurations, you have to
set
meshConfig.defaultConfig.tracing.zipkin.address
from Istio to the Tempo Distributor service and the Zipkin port. Tanka will deploy
the service in distributor.tempo.svc.cluster.local:9411.
The external_services.tracing.in_cluster_url Kiali option needs to be set to:
http://query-frontend.tempo.svc.cluster.local:16685.
Tempo Operator
The Tempo Operator for Kubernetes provides a native Kubernetes solution to deploy Tempo easily in your system.
After installing the Tempo Operator in your cluster, you can create a new Tempo instance with the following CR:
kubectl create namespace tempo
kubectl apply -n tempo -f - <<EOF
apiVersion: tempo.grafana.com/v1alpha1
kind: TempoStack
metadata:
  name: smm
spec:
  storageSize: 1Gi
  storage:
    secret:
      type: s3
      name: object-storage
  resources:
    total:
      limits:
        memory: 2Gi
        cpu: 2000m
  template:
    queryFrontend:
      jaegerQuery:
        enabled: true
        ingress:
          type: ingress
EOF
Note the name of the bucket where the traces will be stored in our example is
called object-storage. Check the
Tempo Operator
documentation to know more about what storages are supported and how to create
the secret properly to provide it to your Tempo instance.
Now, you are ready to configure the
meshConfig.defaultConfig.tracing.zipkin.address
field in your Istio installation. It needs to be set to the 9411 port of the
Tempo Distributor service. For the previous example, this value will be
tempo-smm-distributor.tempo.svc.cluster.local:9411.
Now, you need to configure the in_cluster_url setting from Kiali to access
the Jaeger API. You can point to the 16685 port to use GRPC or 16686 if not.
For the given example, the value would be
http://tempo-ssm-query-frontend.tempo.svc.cluster.local:16685.
There is a related tutorial with detailed instructions to setup Kiali and Grafana Tempo with the Operator.